Clustering and Annotation with Seurat
This vignette demonstrates how to perform clustering on a pre-processed Seurat object and then annotate the resulting clusters using CASSIA. We'll assume quality control steps have already been completed.
1. Installation and Setup
1.1 Required Packages
# Install required packages install.packages(c("Seurat", "dplyr", "reticulate", "devtools")) # Install CASSIA from GitHub library(devtools) devtools::install_github("ElliotXie/CASSIA/CASSIA_R") # Load packages library(Seurat) library(dplyr) library(CASSIA) # Set up API key (needed for CASSIA) setLLMApiKey("your_api_key", provider = "openrouter", persist = TRUE) # or use anthropic/openaiR
2. Exploring Your Pre-processed Seurat Object
In this tutorial, we'll use a breast tissue dataset from the GTEX project as an example. This dataset provides a comprehensive reference for breast tissue cell types and can be downloaded from:
# Load the GTEX breast dataset gtex_data <- readRDS("gtex_ref.rds") # Take a look at the dataset metadata gtex_data@meta.data %>% colnames()R
[1] "orig.ident" "nCount_RNA" "nFeature_RNA" "Broad.cell.type" "Granular.cell.type"
We can see that the dataset includes gold standard cell type labels in the Broad.cell.type and Granular.cell.type columns.
3. Dimensional Reduction and Clustering
3.1 PCA and UMAP
gtex_data <- NormalizeData(object = gtex_data) gtex_data <- FindVariableFeatures(object = gtex_data) gtex_data <- ScaleData(object = gtex_data) gtex_data <- RunPCA(object = gtex_data) gtex_data <- FindNeighbors(object = gtex_data, dims = 1:25) # Use 25 PCs for clustering gtex_data <- FindClusters(object = gtex_data,resolution = 0.4) # Use resolution 0.4 for clustering gtex_data <- RunUMAP(object = gtex_data, dims = 1:25) # Use 25 PCs for UMAP DimPlot(object = gtex_data, reduction = "umap") # Visualize the UMAPR
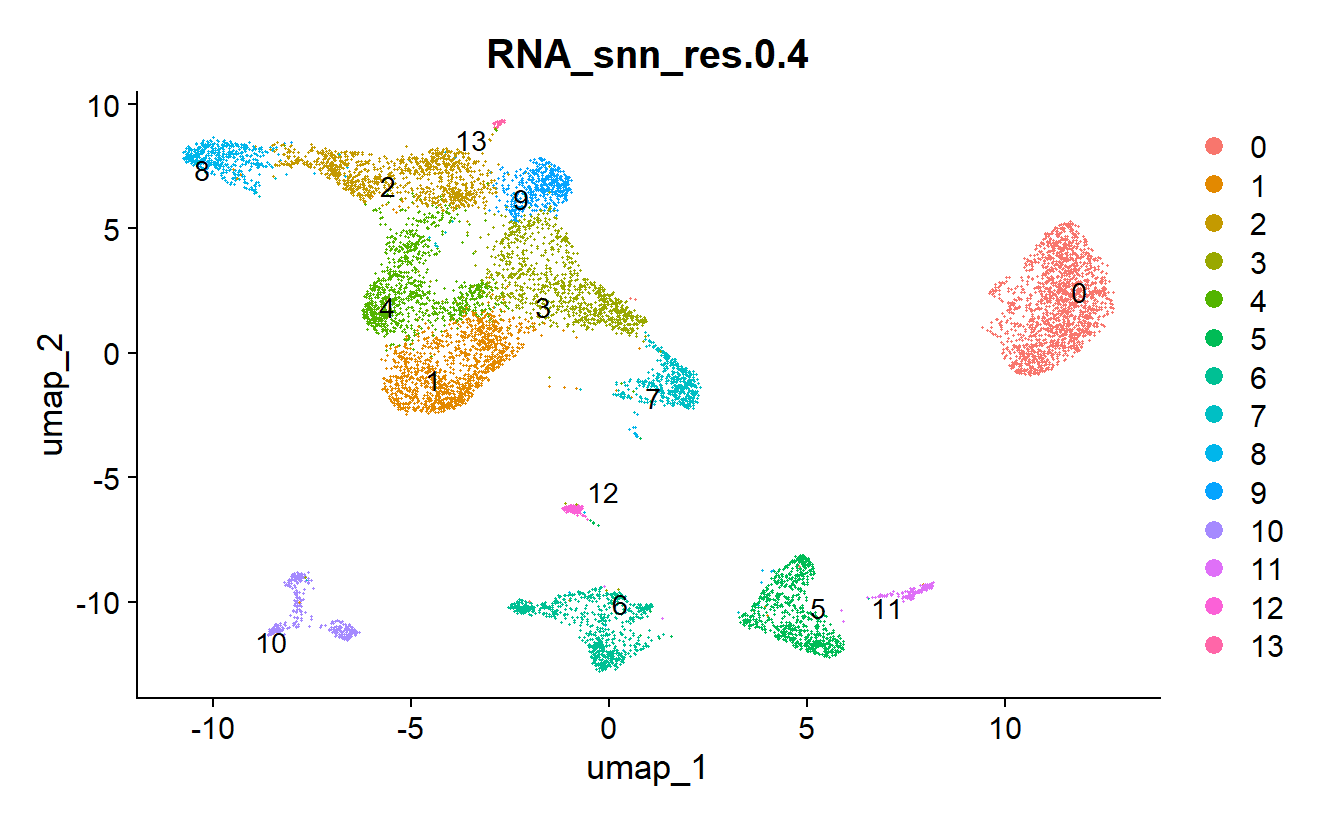
3.3 Finding Marker Genes
Idents(gtex_data)="RNA_snn_res.0.4" # This is the default cluster name if you use the default resolution of 0.4 all_markers <- FindAllMarkers(gtex_data, only.pos = TRUE)R
The marker filter is implemented internally in CASSIA, and the raw marker file is needed for the annotation boost agent too; thus, no filter is needed at this step.
4. Annotating Clusters with CASSIA
4.1 Basic Annotation
Now that we have our clusters and marker genes, we can use CASSIA for annotation:
results <- runCASSIA_pipeline( output_file_name = "gtex_breast_annotation", tissue = "Breast", species = "Human", marker = all_markers, max_workers = 6 # Depends on your CPU cores )R
The default provider is OpenRouter, and the default models are selected to optimize for annotation quality. To see how each new model performs, visit our benchmark website:
sc-llm-benchmark.pages.dev/methods/cassia
The pipeline creates an output folder named CASSIA_Pipeline_{tissue}_{species}_{timestamp}/ with three subfolders:
01_annotation_report/- Interactive HTML reports for the analysis02_annotation_boost/- Annotation boost results for low-scoring clusters03_csv_files/- Summary CSV files including final results
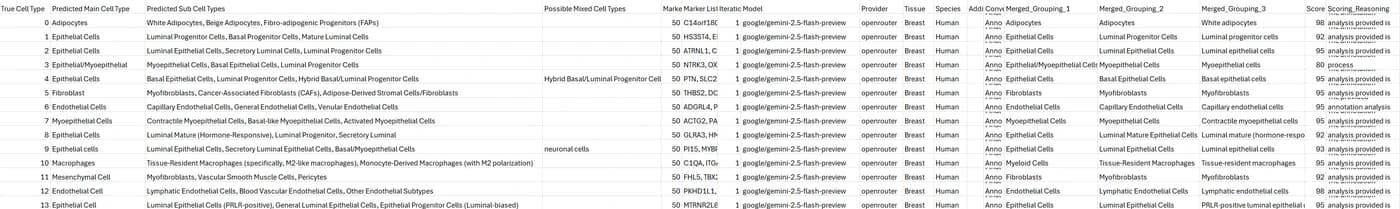
The final results CSV file:
4.2 Incorporating Annotations into Seurat Object
After running CASSIA, you can integrate the annotations back into your Seurat object:
seurat_breast=add_cassia_to_seurat( seurat_obj = gtex_data, cassia_results_path = "CASSIA_Pipeline_Breast_Human_XXXXXX/03_csv_files/gtex_breast_annotation_FINAL_RESULTS.csv", # replace XXXXXX with actual timestamp cluster_col = "RNA_snn_res.0.4", # the column name of the cluster column used for Findallmarkers in the seurat object columns_to_include = 1) # default is to export only the merged column back to seurat, set to 2 if you want to export all the columnsR
4.3 Visualizing the Annotations
DimPlot(seurat_breast,group.by = "Broad.cell.type", label = TRUE, repel = TRUE) DimPlot(seurat_breast,group.by = "Granular.cell.type", label = TRUE, repel = TRUE) DimPlot(seurat_breast,group.by = "RNA_snn_res.0.4", label = TRUE, repel = TRUE) DimPlot(seurat_breast,group.by = "CASSIA_merged_grouping_1", label = TRUE, repel = TRUE) DimPlot(seurat_breast,group.by = "CASSIA_merged_grouping_2", label = TRUE, repel = TRUE) DimPlot(seurat_breast,group.by = "CASSIA_merged_grouping_3", label = TRUE, repel = TRUE)R
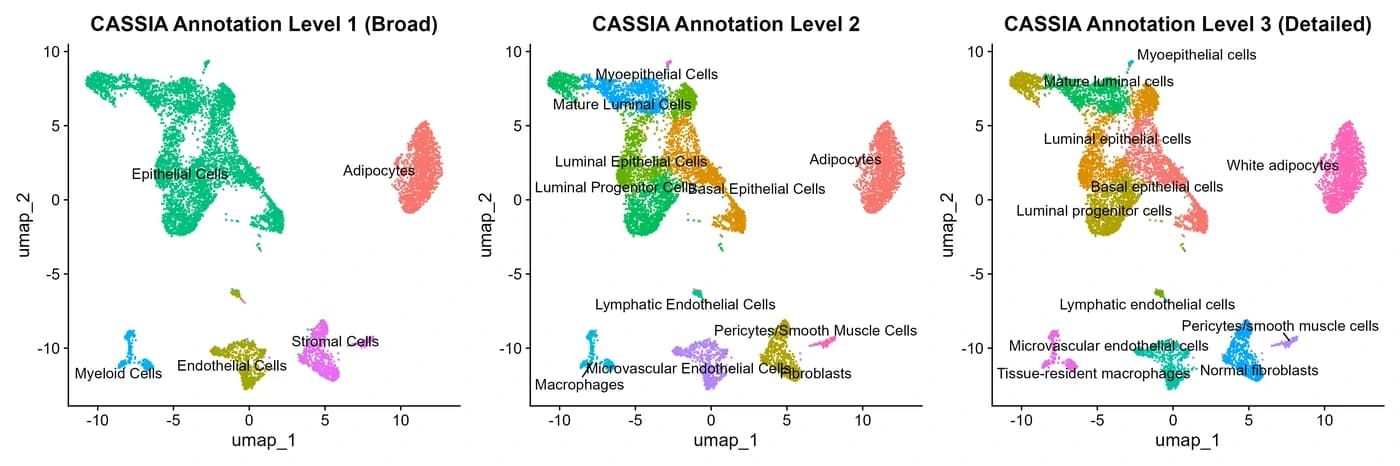
CASSIA will automatically summarize the annotation into three different detailed levels, from the most general to the most detailed, as shown in the UMAPs.
5. Next Steps
After completing clustering and annotation:
- Subset the major clusters and repeat the steps
- Use
runCASSIA_annotationboost()for clusters with low annotation quality - Try
symphonyCompare()to distinguish between similar cell types - Explore
runCASSIA_subclusters()for more detailed analysis of specific populations - Implement
runCASSIA_batch_n_times()for uncertainty quantification